
This time we are jumping to vRealize Operations Manager and looking for an answer to the question: How long was my VM powered on, for example, in the last 7 or 30 days? Sounds simple and it can be useful to show that on SLA reports. Yes, we have a built-in metric in vROPS called System|OS Uptime (Second(s)). So, where is the problem? When we power off VM and power on it again, the counter is starting from zero.
This article will show you how to deal with it using a cool feature called Super Metrics. You can use it with a vROPS Advanced, Enterprise, or SaaS license (it’s not included in the Standard version).
How to calculate
As I mentioned in the introduction, we have a built-in metric called System|OS Uptime (Second(s)). We will use it to create Super Metric that will not be reset when VM will be powered off, but it will keep value.
Assumptions:
- Metrics are calculated by default every 5 minutes. If you changed default time, change formula later.
- If VM OS Uptime between measuring points equals 300 seconds, we will increase our metric by 5 minutes.
- If VM OS Uptime is less than 300 seconds, it means that VM was shut down in the meantime, and we will increase our metric by OS Uptime value. Important: If VM were powered off and on few times in those 5 minutes, we would catch only the last uptime value.
- If VM OS Uptime equals 0 seconds, our metric should not be increased.
- Because we want to calculate metric every cycle, we also will check System|Powered On metric in vROPS. OS Uptime is null while VM is powered off, so our metric would be not calculated.
- Initialization of Super Metric – In this case, our Super Metric will increase itself. We need to initialize this metric on objects. vROPS don’t know about our metrics while creating them, so we cannot refer to them. So, our metric will have a static value of 0.1 for the first few collection cycles.
- Super Metric cannot count historical data.
- Our metric value depends on the availability of vROPS and vCenter. The metric could have a lower value than if there are outages with vCenter, vROps, or anything that can impact the metrics collection process.
Create and initialize Super Metric
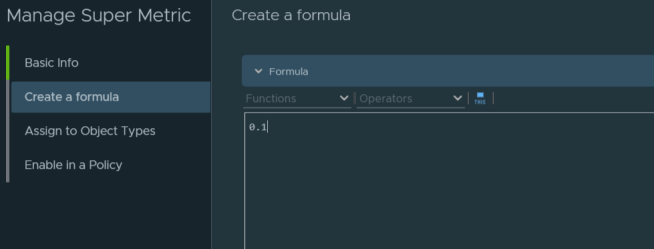
Go to Administration->Configuration->Super Metrics and create new super metric.
Name: .SM – OS Uptime
Description: None
Unit: Hour(s) – depends on you. Remember to change the formula later to corresponding to the correct unit.
Formula: 0.1 (just for initialization)
Assign to Object Types: Virtual Machine
Enable the Policy: <choose your enabled policy>


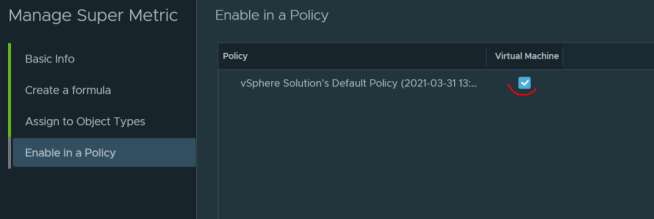
Now, you can take a break or make a coffee 🙂
We have to wait 5-10 minutes (collection cycles) to check that our new super metric appears on virtual machines.

Metric formula
Now, we can go back and edit our Super Metric. Because it is initialized, we can use the same metric in formula.
Few tips:
- To view hints and suggestions, click ctrl+space and select the adapter type, objects, object types, metrics, metrics types, property, and properties types to build your super metric formula.
- THIS – If the This object icon is selected during the creation of a metric expression, it means that the metric expression is associated to the object for which the super metric is created.
- You can also use the Legacy option to create a super metric. In that mode you can search a add metrics, properties, attributes etc.
{This Resource: sys|poweredOn}==1?{This Resource: sys|osUptime_latest}<300?{This Resource: Super Metrics|.SM - OS Uptime}+({This Resource: sys|osUptime_latest}/3600):{This Resource: Super Metrics|.SM - OS Uptime}+(300/3600):{This Resource: Super Metrics|.SM - OS Uptime}
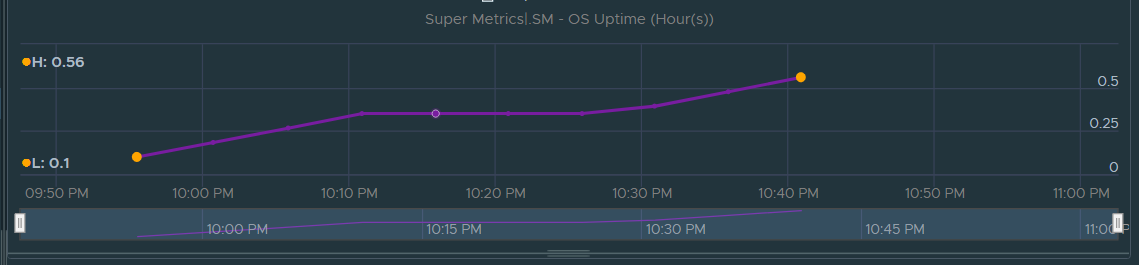
Let’s explain step by step what happens in that formula.
1) Condition expression: expression_condition ? expression_if_true : expression_if_false. And here we have IF condition inside IF condition. The the beginning we check metric System|Powered On. If VM is powered on we check if built-in metric OS Uptime is less than 300 seconds or not.
2) IF TRUE: We take our Super Metric called Uptime in hours and add to it built-in metric OS Uptime divided by 3600. OS Uptime is in seconds, so we need to divide it by 3600 to get hours. (Example: if OS Uptime from vROPS is 200 seconds, because VM was rebooted we will add only 200 seconds to our counter).
3) IF FALSE: Just add 5 minutes to our Super Metric. (300 seconds divided by 3600).
4) If VM is powered off. We just repeat our Super Metric value.
That’s all? No. Now we have a metric that shows us uptime. But what if we want to know how much time our VMs were powered on in the last 7 days? The last value of our metric gives us information about uptime since Super Metric was created. We need to create a View and calculate what we need.
Creating a View
So, how we can count uptime in last X days, hours etc? We must catch minimum and maximum value in this time and substract minimum from maximum.
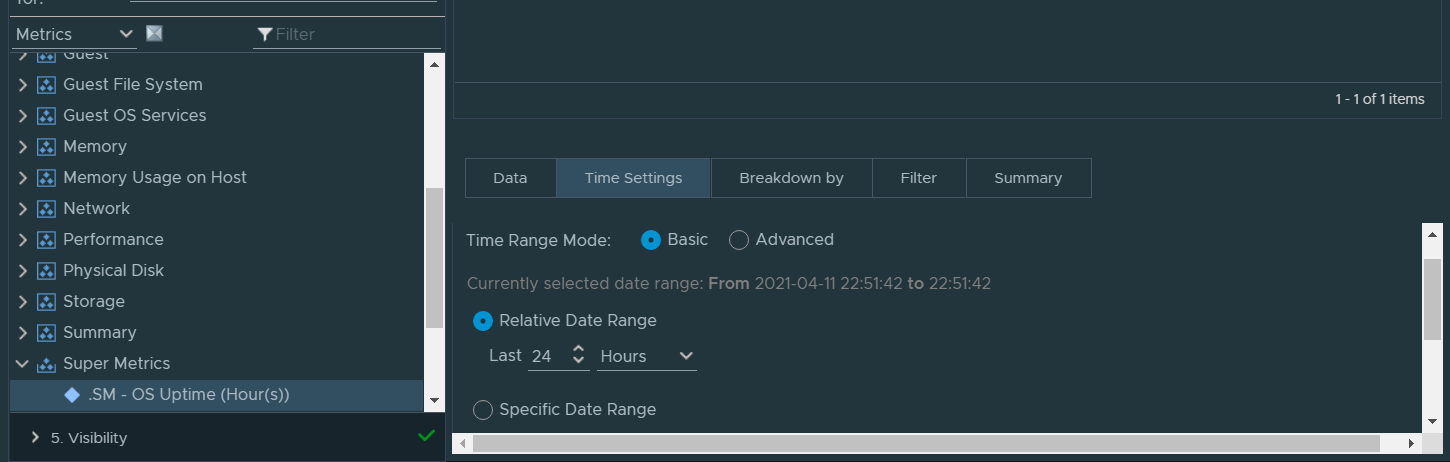
Go to Dashboards->Views and Add new one.
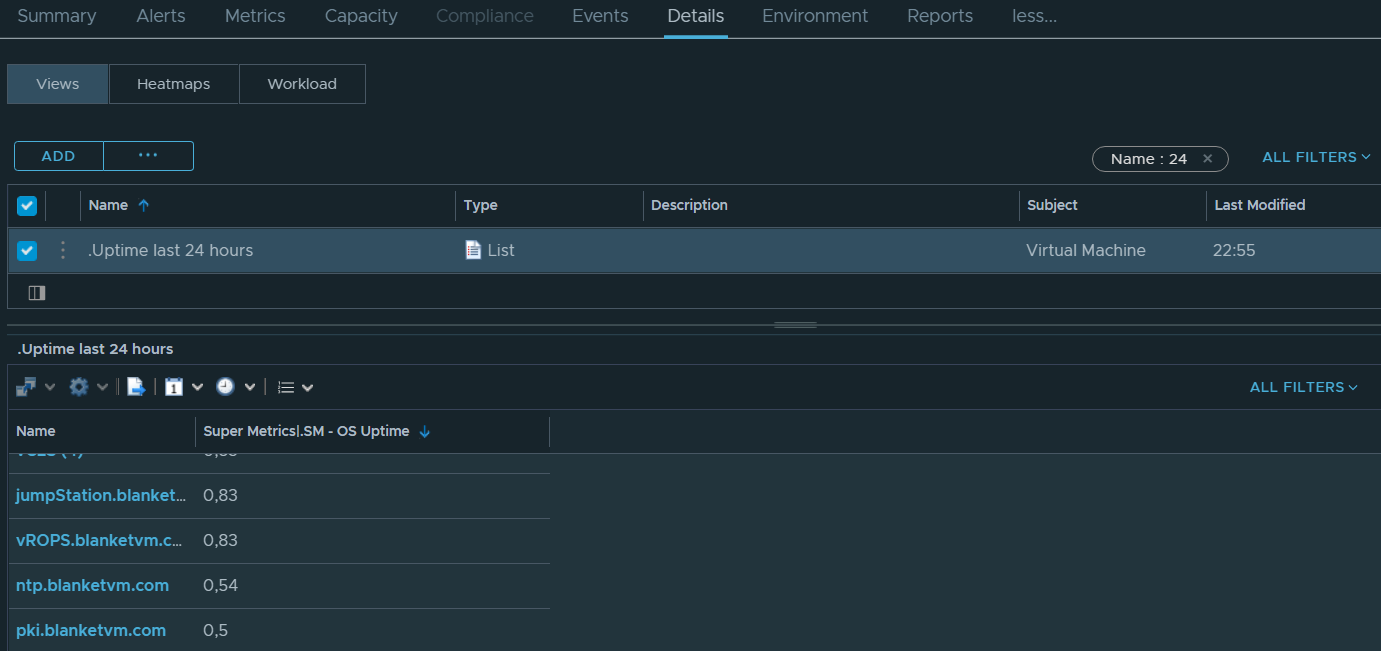
Name: .Uptime last 24 hours (or whatever you want)
Description: None
Presentation: List
Subjects: Virtual Machine
Data: Add Super Metric -> Uptime in hour(s). Change transformation to Expression and type: max-min
Data: Click on Time Settings and set time how you want. in my case I have the last 24h hours.
Data: Click on Select preview source and choose one VM for test (you can skip that).
Set Visibility and click Save.
And we can go to our vSphere environment and use our view.


Important: Remember that vROPS update value every 5 minutes. For example if we take a time between 1:00pm and 2:00pm. The first collection cycle will be for example at 1:02pm so the last before 2:00pm will be at 1:57pm. That’s the reason why VM uptime between 1pm and 2pm may be not equal 1 hour!
Resources
Self-Driving Operations by VMware vRealize Operations.
Super Metric Functions and Operators.
Summary
That was only one of the examples of how we could use Super Metrics. I suggest you play with that. Our OS Uptime metric can be handy if you need to create reports for SLA purposes or just for your supervisors. Have fun.

Excellent post! I do have one query. The first metric is 0.1 and then you add the formula. Problem here is new VMs will be missing the initialisation of 0.1 and therefore have no metric. Were you able to get around this?
LikeLike
Should work also for new VMs.
That trick with 0.1. value is just to build Super Metric. In the formula, we need to add SM which must exists, that’s all.
If you test it and it does not work for new VMs let me know and I will check of again on my lab.
LikeLike
Thanks, I have been using this for a few months now so perhaps it is a change in behaviour. I created some new VMs again in a different setup and they are missing the metric. As soon as I replace the metric with 0.1 they populate with 0.1 and I can revert to the formula again.
LikeLike
Hi Donagh,
Sorry for the late response, but I had to double-check it on my lab. You’re right. The Super Metric does not show for new VMs.
As a workaround, my idea is to tag new VMs with a vSphere Tag (for example, newVM) and add a condition to Super Metric that if such a tag exists, its value equals 0.1.
Then, the tag should be removed. And SM will calculate values correctly.
If you use Aria Automation Orchestrator, it can be a fully automated process. Through REST API, vRO can get all new VMs, compare their creation date with the current time, and decide whether to leave or remove vSphere tags.
LikeLike
I am a little bit confused on the last 24hours because technically if I am looking for the last 24hours that a VM was up, shouldn’t it show 24hours?
LikeLike
In general, YES. If the VM has been up for the last 24 hours, the value should be 24 hours.
But I added a comment for the time Super Metric was created. If you created SM at 9:58 a.m., and the first calculation will take place at 10:01 a.m., and you will check the uptime from the last 1 hour at 11 a.m., you will not see the full hour yet.
LikeLike