
In the previous post (PART I), I described how to deploy the Open Source Telegraf agent on a Linux VM. This time we keep focus on the Windows OS. If you want to read a few words of introduction and find out how you can use Telegraf agent, go to the PART I.
List of all parts:
- PART I: Deploy Open Source Telegraf Agent on Linux VM (Ubuntu 22.04 LTS).
- PART II: Deploy Open Source Telegraf Agent on Windows VM (Windows Server 2022).
- PART III: Monitor Active Directory using Open Source Telegraf Agent – TBD
STEP 1: Prerequisites
Prerequisites for the Windows OS::
- PowerShell version 4.0 or above.
- VMware Tools version >-10.2 (suggested to use the newest one).
- IPv4, (Only IPv4 is currently supported).
Required network traffic:
- VM/Endpoint must have access to ports 8443 and 443 of cloud proxy or the virtual IP of the application monitoring high availability activated collector group (As you can see ports 4505 and 4506 are not used here, those ports are required only for Managed agent).
- Remote Access (RDP) from your workstation to Windows Server.
STEP 2: Open Source agent installation.
To install Telegraf agent go to https://www.influxdata.com/time-series-platform/telegraf/ and click button Download Telegraf v1.30.1 (version may be different).
You will see instructions for various operating systems. We will use Windows version.
To install Telegraf agent on WIndows Server run commands in the PowerShell console (run console as Admin) as follow:
If your server does not have Internet access, you can download binaries on another Windows machine and copy files on the target machine.
PS C:\Users\Administrator.BLANKETVM> hostname                                                                                                                                                                                dns02                                                                                                                                                                                                                        PS C:\Users\Administrator.BLANKETVM> mkdir c:\TMP\
    Directory: C:\
Mode                 LastWriteTime         Length Name
----                 -------------         ------ ----
d-----         4/15/2024   5:37 PM                TMP
PS C:\Users\Administrator.BLANKETVM> cd C:\TMP\
PS C:\TMP> wget https://dl.influxdata.com/telegraf/releases/telegraf-1.30.1_windows_amd64.zip -UseBasicParsing -OutFile telegraf-1.30.1_windows_amd64.zip
PS C:\TMP> Expand-Archive .\telegraf-1.30.1_windows_amd64.zip -DestinationPath 'C:\Program Files\InfluxData\telegraf'
PS C:\TMP> mkdir 'C:\Program Files\InfluxData\telegraf\telegraf.d'
    Directory: C:\Program Files\InfluxData\telegraf
Mode                 LastWriteTime         Length Name
----                 -------------         ------ ----
d-----         4/15/2024   5:43 PM                telegraf.d
STEP 3: Configure Telegraf to send data to cloud proxy
Now, we need to configure our Telegraf agent to send data to Cloud Proxy. To do that we will need to download script from Cloud Proxy, run that script with required parameters and prepare config file. Let’s go.
Download the helper script from cloud proxy located at Download the helper script from cloud proxy located at https://<CloudProxy-IP>/downloads/salt/telegraf-utils.ps1
NOTE: Download the script using the below commands in the command line (not PowerShell). If you use PS, there might be an error regarding the certificate. Here you can find a workaround:
https://docs.vmware.com/en/VMware-Aria-Operations/8.17.1/Configuring-Operations/GUID-FA70A401-C338-4CDF-AD14-F31185D6138B.html#GUID-FA70A401-C338-4CDF-AD14-F31185D6138B
Microsoft Windows [Version 10.0.20348.2322]
(c) Microsoft Corporation. All rights reserved.
C:\Users\Administrator.BLANKETVM>cd c:/TMP
c:\TMP>curl -k  "https://vcf-md01-vrops01cp01.blanketvm.com/downloads/salt/telegraf-utils.ps1" -o telegraf-utils.ps1
  % Total    % Received % Xferd  Average Speed   Time    Time     Time  Current
                                 Dload  Upload   Total   Spent    Left  Speed
100 72834  100 72834    0     0   728k      0 --:--:-- --:--:-- --:--:--  790k
Run the helper script to update Telegraf configurations.
To run the scripts we will need:
- Cloud Proxy IP or Collector Group Name (in my case I will use group name because I have enabled High-Availability on the Cloud Proxies).

- Auth Token of the user/account. For getting a new token, go to: https://<VMwareAriaOperations_IP>/suite-api/ find Auth and run /api/auth/token/acquire REAST call (remember to log before that to Aria Operations).


authSource name must be the same as configured in Aria Operations:

- Aria Operations FQDN.
- Path for config files and binaries: C:\Program Files\InfluxData\telegraf\telegraf.d and C:\Program Files\InfluxData\telegraf\telegraf-1.30.1
PS C:\TMP> .\telegraf-utils.ps1  opensource -c "CloudProxy Collection Group" -t 5e16db73-8086-433a-89ac-0a2e562dc0b8::68200f37-d58b-4b91-9673-0c23e13e11c0 -d "C:\Program Files\InfluxData\telegraf\telegraf.d"  -e "C:\Program Files\InfluxData\telegraf\telegraf-1.30.1\telegraf.exe" -v vcf-md01-vrops01.blanketvm.com
Telegraf configuration to post metrics to cloud proxy succeeded. Please restart telegraf.NOTE:
By default, the InfluxDB output plugin is active in the telegraf.conf file and data is sent to the influxdb server so that you do not get multiple warning messages in the logs about the lack of configured influxdb server comment, the “[[outputs.influxdb]]” line should be commented. The following warning message is displayed: W! [outputs.influxdb] When writing to [http://localhost:8086]: database "telegraf" creation failed: Post "http://localhost:8086/query": dial tcp [::1]:8086: connect: connection refused
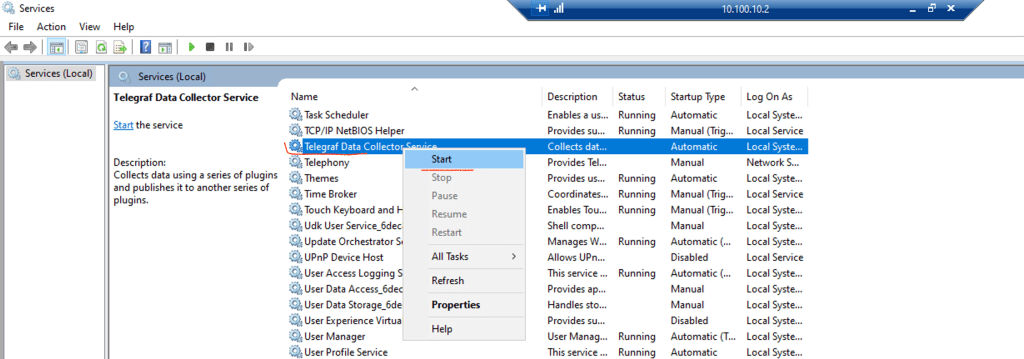
STEP 4: Create a service
To create a Windows Service for Telegraf agent (to start automatically with OS) run this command:
PS C:\TMP> & "C:\Program Files\InfluxData\telegraf\telegraf-1.30.1\telegraf.exe" --config "C:\Program Files\InfluxData\telegraf\telegraf-1.30.1\telegraf.conf" --config-directory "C:\Program Files\InfluxData\telegraf\telegraf.d" --service installSTEP 5: Ensure that OS plugin is configured properly
Go to C:\Program Files\InfluxData\telegraf\telegraf.d directory and open file: win-perf-couters.conf
Confirm that file contains configuration as below:
##########################################################################################
[[inputs.win_perf_counters]]
PrintValid=true

[[inputs.win_perf_counters.object]]
  ObjectName = "Processor"
  Instances = ["*"]
  Counters = ["% Idle Time", "% Interrupt Time", "% Privileged Time", "% Processor Time", "% User Time", "Interrupts/sec", "% DPC Time"]
  Measurement = "win.cpu"
  IncludeTotal = true

[[inputs.win_perf_counters.object]]
  ObjectName = "LogicalDisk"
  Instances = ["*"]
  Counters = ["% Disk Read Time", "% Disk Write Time", "% Free Space", "% Idle Time", "Avg. Disk Bytes/Read", "Avg. Disk Bytes/Write", "Avg. Disk Queue Length", "Avg. Disk sec/Read", "Avg. Disk sec/Write", "Avg. Disk Write Queue Length", "Avg. Disk Read Queue Length", "Free Megabytes", "Split IO/Sec"]
  Measurement = "win.disk"

[[inputs.win_perf_counters.object]]
  ObjectName = "Memory"
  Counters = ["Available Bytes", "Cache Bytes", "Committed Bytes", "Cache Faults/sec", "Demand Zero Faults/sec", "Page Faults/sec", "Pages/sec", "Transition Faults/sec", "Pool Nonpaged Bytes", "Pool Paged Bytes"]
  Instances = ["------"]
  Measurement = "win.mem"

[[inputs.win_perf_counters.object]]
  ObjectName = "Network Interface"
  Counters = ["Bytes Received/sec", "Bytes Sent/sec", "Packets Outbound Discarded", "Packets Outbound Errors", "Packets Received Discarded", "Packets Received Errors", "Packets Received/sec", "Packets Sent/sec", "Connections Established"]
  Instances = ["*"]
  Measurement = "win.net"
  IncludeTotal = true

[[inputs.win_perf_counters.object]]
  ObjectName = "Paging File"
  Counters = ["% Usage"]
  Instances = ["*"]
  Measurement = "win.paging"
  IncludeTotal = true

  [[inputs.win_perf_counters.object]]
    ObjectName = "Process"
    Counters = ["% Privileged Time", "% Processor Time", "% User Time", "Elapsed Time", "Handle Count", "IO Read Bytes/sec", "IO Read Operations/sec", "IO Write Bytes/sec", "IO Write Operations/sec", "Private Bytes", "Thread Count", "Virtual Bytes", "Working Set", "Working Set - Private"]
    Instances = ["_Total", "telegraf", "w3wp"]         # Replace this with a list of process names that you want to monitor. "_Total" is all processes combined
    Measurement = "win.process"

[[inputs.win_perf_counters.object]]
  ObjectName = "System"
  Counters = ["Context Switches/sec", "Processes", "Processor Queue Length", "System Calls/sec", "System Up Time", "Threads"]
  Instances = ["------"]
  Measurement = "win.system"

[[inputs.win_perf_counters.object]]
  ObjectName = "TCPv4"
  Counters = ["Connection Failures", "Connections Active", "Connections Established", "Connections Passive", "Connection Reset", "Segments Received/sec", "Segments Retransmitted/sec", "Segments Sent/sec"]
  Instances = ["------"]
  Measurement = "win.net.tcp"

[[inputs.win_perf_counters.object]]
  ObjectName = "TCPv6"
  Counters = ["Connection Failures", "Connections Active", "Connections Established", "Connections Passive", "Connection Reset", "Segments Received/sec", "Segments Retransmitted/sec", "Segments Sent/sec"]
  Instances = ["------"]
  Measurement = "win.net.tcp"

[[inputs.win_perf_counters.object]]
  ObjectName = "UDPv4"
  Counters = ["Datagrams No Port/sec", "Datagrams Received/Errors", "Datagrams Received/sec", "Datagrams Sent/sec"]
  Instances = ["------"]
  Measurement = "win.net.udp"

[[inputs.win_perf_counters.object]]
  ObjectName = "UDPv6"
  Counters = ["Datagrams No Port/sec", "Datagrams Received/Errors", "Datagrams Received/sec", "Datagrams Sent/sec"]
  Instances = ["------"]
  Measurement = "win.net.udp"
##########################################################################################
Remember that it is a default configuration. We will adjust it to our requirements in the next parts.
START Telegraf agent and confirm that all works fine.
STEP 6: Check that all config files are loaded
Open Event Viewer on the Microsoft Windows OS and go to Windows Logs -> Application
You should see a few entries with a Source: telegraf. Check that all configuration files are listed:
Loading config: C:\Program Files\InfluxData\telegraf\telegraf-1.30.1\telegraf.conf
Loading config: C:\Program Files\InfluxData\telegraf\telegraf-1.30.1\win-perf-counters.conf
Loading config: C:\Program Files\InfluxData\telegraf\telegraf-1.30.1\cloudproxy-http.conf
Conclusion
Now, we need to wait a few collection cycle to see in the Aria Operations UI changes. After some time you should be able to see agent an OS object.


Have fun!
If you have any questions about the procedure leave the comment.

Hello!!
I tried configuring it based on what you wrote and found that Aria Operations collects metrics for a single VM + single GPU just fine. Thank you.
However, there seems to be an issue with Single VM + Multiple GPUs where only the values for a specific GPU are collected and not for all GPUs, is there anything you know about this?
LikeLike
Hi,
It looks like wrong configuration of Telegraf Plugins.
I see here two options:
a) If you have GPU metrics in Windows Performance Monitor, you can add additional counters to Windows metrics and gather it using Windows Performance Counters Input Plugin. Remember here to add all Instances of GPU.
https://github.com/influxdata/telegraf/blob/release-1.33/plugins/inputs/win_perf_counters/README.md
b) If it is NVIDIA, you can use NVIDIA Plugin:
https://github.com/influxdata/telegraf/blob/release-1.33/plugins/inputs/nvidia_smi/README.md
Unfortunately, I do not have a lab with multiple GPUs to check it on my side.
LikeLike