
Aria Operations supports two kinds of Telegraf Agents: Managed and Open Source Telegraf agents. What is the advantage of using an Open Source Telegraf agent? It supports more applications and is fully configurable. For example, Active Directory monitoring can be done using Managed Agent and Open Source. If you configure Managed Agent, you will see a set of metrics and properties, but you cannot add others. Using the Open Source version lets you decide which metrics are essential and which non-default you want in the Aria Operations. The same situation is with Operating Systems. The managed agent has a set of metrics that can be monitored. Open Source can monitor anything available in the OS.
In the next few posts, I will go through the installation and configuration of the Open Source Telegraf agent and some example plugins. I will try to do that for both operating systems: Windows (Windows Server 20122 or 2019) and Linux (Ubuntu). Today, we will start with PART I that explains how to deploy agent on Linux VM and monitor Operating System.
All available plugins you can find here (over 300+ plugins):
https://www.influxdata.com/products/integrations/
List of all parts:
- PART I: Deploy Open Source Telegraf Agent on Linux VM (Ubuntu 22.04 LTS).
- PART II: Deploy Open Source Telegraf Agent on Windows VM (Windows Server 2022).
- PART III: Monitor Active Directory using Open Source Telegraf Agent – TBD
STEP 1: Prerequisites
Required packages:
- jq, see the official documentation for jq from https://stedolan.github.io/jq/download/
- open-vm-tools, version >-10.2 (suggested to use the newest one).
- coreutils, required for commands: chmod, chown, cat).
- net-tools, required for commands: ip, curl, wget.
- unzip, version 6.0-10.el7 or above.
- uuidgen
- open-vm-tools-sdmp, not required but I always suggest to install it for Service Discovery.
Required network traffic:
- VM/Endpoint must have access to ports 8443 and 443 of cloud proxy or the virtual IP of the application monitoring high availability activated collector group (As you can see ports 4505 and 4506 are not used here, those ports are required only for Managed agent).
- SSH access from your workstation to Ubuntu Server.
STEP 2: Open Source agent installation.
To install Telegraf agent go to https://www.influxdata.com/time-series-platform/telegraf/ and click button Download Telegraf v1.30.1 (version may be different).
You will see instructions for various operating systems. We will use Ubuntu version.
To install Telegraf agent on Ubuntu Server run commands as follow:
root@mail01:~# cd /tmp

root@mail01:/tmp# wget -q https://repos.influxdata.com/influxdata-archive_compat.key

root@mail01:/tmp# echo '393e8779c89ac8d958f81f942f9ad7fb82a25e133faddaf92e15b16e6ac9ce4c influxdata-archive_compat.key' | sha256sum -c && cat influxdata-archive_compat.key | gpg --dearmor | sudo tee /etc/apt/trusted.gpg.d/influxdata-archive_compat.gpg > /dev/null
influxdata-archive_compat.key: OK

root@mail01:/tmp# echo 'deb [signed-by=/etc/apt/trusted.gpg.d/influxdata-archive_compat.gpg] https://repos.influxdata.com/debian stable main' | sudo tee /etc/apt/sources.list.d/influxdata.list
deb [signed-by=/etc/apt/trusted.gpg.d/influxdata-archive_compat.gpg] https://repos.influxdata.com/debian stable main

root@mail01:/tmp# sudo apt-get update && sudo apt-get install telegraf
...
The following NEW packages will be installed:
  telegraf
0 upgraded, 1 newly installed, 0 to remove and 19 not upgraded.
...
Get:1 https://repos.influxdata.com/debian stable/main amd64 telegraf amd64 1.30.1-1 [60.4 MB]
Fetched 60.4 MB in 2s (39.6 MB/s)
...
Unpacking telegraf (1.30.1-1) ...
Setting up telegraf (1.30.1-1) ...
Created symlink /etc/systemd/system/multi-user.target.wants/telegraf.service → /lib/systemd/system/telegraf.service.
...
No VM guests are running outdated hypervisor (qemu) binaries on this host.
STEP 3: Configure Telegraf to send data to cloud proxy
Now, we need to configure our Telegraf agent to send data to Cloud Proxy. To do that we will need to download script from Cloud Proxy, run that script with required parameters and prepare config file. Let’s go.
Download the helper script from cloud proxy located at Download the helper script from cloud proxy located at https://<CloudProxy-IP>/downloads/salt/telegraf-utils.sh
root@mail01:/tmp# wget --no-check-certificate  https://vcf-md01-vrops01cp01.blanketvm.com/downloads/salt/telegraf-utils.sh
--2024-04-11 21:33:33--  https://vcf-md01-vrops01cp01.blanketvm.com/downloads/salt/telegraf-utils.sh
Resolving vcf-md01-vrops01cp01.blanketvm.com (vcf-md01-vrops01cp01.blanketvm.com)... 10.150.101.15
Connecting to vcf-md01-vrops01cp01.blanketvm.com (vcf-md01-vrops01cp01.blanketvm.com)|10.150.101.15|:443... connected.
WARNING: cannot verify vcf-md01-vrops01cp01.blanketvm.com's certificate, issued by ‘OU=VMware\\, Inc.,O=VMware\\, Inc.,CN=vROps-cluster-ca_f0b5b59e-113a-4518-a5e9-801cfa3526aa’:
  Self-signed certificate encountered.
WARNING: no certificate subject alternative name matches
        requested host name ‘vcf-md01-vrops01cp01.blanketvm.com’.
HTTP request sent, awaiting response... 200 OK
Length: 48919 (48K)
Saving to: ‘telegraf-utils.sh’

telegraf-utils.sh                           100%[==========================================================================================>]  47.77K  --.-KB/s    in 0.004s

2024-04-11 21:33:33 (12.4 MB/s) - ‘telegraf-utils.sh’ saved [48919/48919]

root@mail01:/tmp# chmod +x telegraf-utils.sh
root@mail01:/tmp# ls -al
total 152
...
-rwxr-xr-x  1 root root 48919 Mar 28 17:52 telegraf-utils.sh
...
Run the helper script to update Telegraf configurations.
To run the scripts we will need:
- Cloud Proxy IP or Collector Group Name (in my case I will use group name because I have enabled High-Availability on the Cloud Proxies).

- Auth Token of the user/account. For getting a new token, go to: https://<VMwareAriaOperations_IP>/suite-api/ find Auth and run /api/auth/token/acquire REAST call (remember to log before that to Aria Operations).


authSource name must be the same as configured in Aria Operations:

- Aria Operations FQDN.
- Path for config files and binaries: /etc/telegraf/telegraf.d and /usr/bin/telegraf
root@mail01:/tmp# ./telegraf-utils.sh  opensource -c "CloudProxy Collection Group" -t 5e16db73-8086-433a-89ac-0a2e562dc0b8::0110237b-dc71-49b0-a943-51787be015a5 -d /etc/telegraf/telegraf.d  -e /usr/bin/telegraf -v vcf-md01-vrops01.blanketvm.com
Telegraf configuration to post metrics to cloud proxy succeeded. Please restart telegraf.NOTE:
By default, the InfluxDB output plugin is active in the telegraf.conf file and data is sent to the influxdb server so that you do not get multiple warning messages in the logs about the lack of configured influxdb server comment, the “[[outputs.influxdb]]” line should be commented. The following warning message is displayed: W! [outputs.influxdb] When writing to [http://localhost:8086]: database "telegraf" creation failed: Post "http://localhost:8086/query": dial tcp [::1]:8086: connect: connection refused
STEP 4: Ensure that OS plugin is configured properly
Confirm that telegraf.conf file located in /etc/telegraf/telegraf.conf contains default configuration corresponding to the OS:
##########################################################################################
# Read metrics about cpu usage
[[inputs.cpu]]
  ## Whether to report per-cpu stats or not
  percpu = true
  ## Whether to report total system cpu stats or not
  totalcpu = true
  ## If true, collect raw CPU time metrics
  collect_cpu_time = true
  ## If true, compute and report the sum of all non-idle CPU states
  report_active = true

# Read metrics about memory usage
[[inputs.mem]]
  # no configuration

# Read metrics about system load & uptime
[[inputs.system]]
  ## Uncomment to remove deprecated metrics.
  # fielddrop = ["uptime_format"]

# Read metrics about network interface usage
[[inputs.net]]
  ## By default, telegraf gathers stats from any up interface (excluding loopback)
  ## Setting interfaces will tell it to gather these explicit interfaces,
  ## regardless of status.
  ##
 # interfaces = ["eth0"]

# Read metrics about swap memory usage
[[inputs.swap]]
  # no configuration

# Read metrics about disk usage by mount point
[[inputs.disk]]
  ## By default stats will be gathered for all mount points.
  ## Set mount_points will restrict the stats to only the specified mount points.
  # mount_points = ["/"]

  ## Ignore mount points by filesystem type.
  # ignore_fs = ["tmpfs", "devtmpfs", "devfs", "iso9660", "overlay", "aufs", "squashfs"]

# Get the number of processes and group them by status
[[inputs.processes]]
  # no configuration

# Read metrics about disk IO by device
[[inputs.diskio]]
  ## By default, telegraf will gather stats for all devices including
  ## disk partitions.
  ## Setting devices will restrict the stats to the specified devices.
  # devices = ["sda", "sdb", "vd*"]
  ## Uncomment the following line if you need disk serial numbers.
  # skip_serial_number = false
##########################################################################################
Remember that it is a default configuration. We will adjust it to our requirements in the next parts.
Restart Telegraf agent and confirm that all works fine.
root@mail01:~# systemctl restart telegraf
Job for telegraf.service failed because the control process exited with error code.
See "systemctl status telegraf.service" and "journalctl -xeu telegraf.service" for details.
Ups….something went wrong?
Do not worry, it is expected. Let’s check where is the problem.
Run command: journalctl -xeu telegraf.service and search for errors.

Apr 11 22:22:13 mail01 telegraf[1970]: 2024-04-11T20:22:13Z I! Loading config: /etc/telegraf/telegraf.conf
Apr 11 22:22:13 mail01 telegraf[1970]: 2024-04-11T20:22:13Z I! Loading config: /etc/telegraf/telegraf.d/cloudproxy-http.conf
Apr 11 22:22:13 mail01 telegraf[1970]: 2024-04-11T20:22:13Z E! error loading config file /etc/telegraf/telegraf.d/cloudproxy-http.conf: error parsing http array, could not load certificate "/etc/telegraf/telegraf.d/cert.pem": open /etc/telegraf/telegraf.d/cert.pem: permission denied
Apr 11 22:22:13 mail01 systemd[1]: telegraf.service: Main process exited, code=exited, status=1/FAILURE
Certificate file cannot be open. Fix it:
root@mail01:/tmp# cd /etc/telegraf/telegraf.d/
root@mail01:/etc/telegraf/telegraf.d# ls -al
total 28
drwxr-xr-x 2 root root 4096 Apr 11 22:02 .
drwxr-xr-x 3 root root 4096 Apr 11 22:14 ..
-rw-r----- 1 root root 1467 Apr 11 22:02 cert.pem
-rw-r--r-- 1 root root  991 Apr 11 22:02 cloudproxy-http.conf
-rw-r----- 1 root root   14 Apr 11 22:02 IP
-rw-r----- 1 root root 1704 Apr 11 22:02 key.pem
-rw-r--r-- 1 root root 2188 Apr 11 22:02 mandatory_tags.sh
root@mail01:/etc/telegraf/telegraf.d# chmod 644 cert.pem
root@mail01:/etc/telegraf/telegraf.d# chmod 644 key.pem
root@mail01:/etc/telegraf/telegraf.d# ls -al
total 28
drwxr-xr-x 2 root root 4096 Apr 11 22:02 .
drwxr-xr-x 3 root root 4096 Apr 11 22:14 ..
-rw-r--r-- 1 root root 1467 Apr 11 22:02 cert.pem
-rw-r--r-- 1 root root  991 Apr 11 22:02 cloudproxy-http.conf
-rw-r----- 1 root root   14 Apr 11 22:02 IP
-rw-r--r-- 1 root root 1704 Apr 11 22:02 key.pem
-rw-r--r-- 1 root root 2188 Apr 11 22:02 mandatory_tags.sh
root@mail01:/etc/telegraf/telegraf.d# systemctl restart telegraf
root@mail01:/etc/telegraf/telegraf.d# systemctl status telegraf
● telegraf.service - Telegraf
     Loaded: loaded (/lib/systemd/system/telegraf.service; enabled; vendor preset: enabled)
     Active: active (running) since Thu 2024-04-11 22:29:43 CEST; 2min 55s ago
       Docs: https://github.com/influxdata/telegraf
   Main PID: 5236 (telegraf)
      Tasks: 8 (limit: 2220)
     Memory: 35.5M
        CPU: 461ms
     CGroup: /system.slice/telegraf.service
             └─5236 /usr/bin/telegraf -config /etc/telegraf/telegraf.conf -config-directory /etc/telegraf/telegraf.d

Apr 11 22:29:43 mail01 telegraf[5236]: 2024-04-11T20:29:43Z I! Starting Telegraf 1.30.1 brought to you by InfluxData the makers of InfluxDB
Apr 11 22:29:43 mail01 telegraf[5236]: 2024-04-11T20:29:43Z I! Available plugins: 233 inputs, 9 aggregators, 31 processors, 24 parsers, 60 outputs, 6 secret-stores
Apr 11 22:29:43 mail01 telegraf[5236]: 2024-04-11T20:29:43Z I! Loaded inputs: cpu disk diskio exec kernel mem processes swap system
Apr 11 22:29:43 mail01 telegraf[5236]: 2024-04-11T20:29:43Z I! Loaded aggregators:
Apr 11 22:29:43 mail01 telegraf[5236]: 2024-04-11T20:29:43Z I! Loaded processors:
Apr 11 22:29:43 mail01 telegraf[5236]: 2024-04-11T20:29:43Z I! Loaded secretstores:
Apr 11 22:29:43 mail01 telegraf[5236]: 2024-04-11T20:29:43Z I! Loaded outputs: http
Apr 11 22:29:43 mail01 telegraf[5236]: 2024-04-11T20:29:43Z I! Tags enabled: host=mail01
Apr 11 22:29:43 mail01 systemd[1]: Started Telegraf.
Apr 11 22:29:43 mail01 telegraf[5236]: 2024-04-11T20:29:43Z I! [agent] Config: Interval:5m0s, Quiet:false, Hostname:"mail01.blanketvm.com", Flush Interval:1m0s
Conclusion
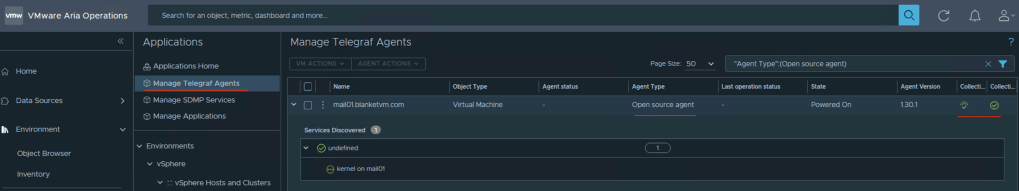
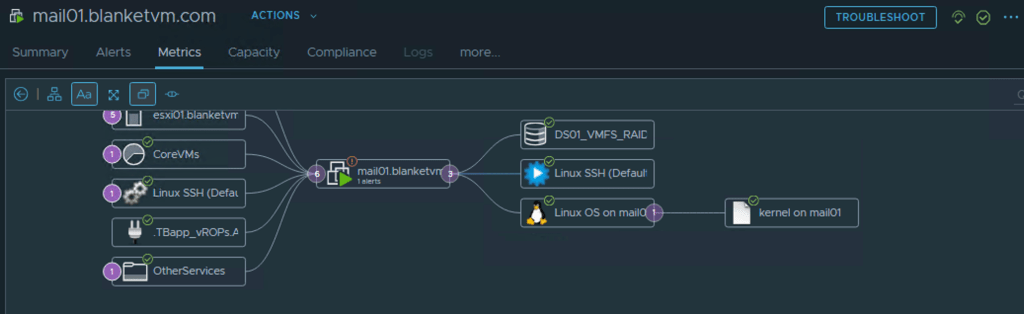
Now, we need to wait a few collection cycle to see in the Aria Operations UI changes. After some time you should be able to see agent an OS object.

Have fun!

One thought on “Aria Operations – PART I: Deploy Open Source Telegraf agent on Linux VM.”